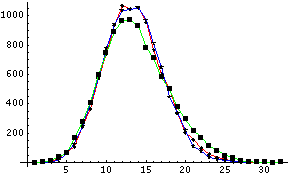
- Here is the output from 10 runs.
In each run, I generated a small world graph (as in Project 1) with n = 10,000 on a 50 by 50 square
with p = 0.1 and chose 1000 st-pairs chosen uniformly at random.
The success rate of the greedy algorithm is around 91% and the average number of hops and the average
Euclidean distance traveled by the message is around 14 and 44 respectively.
It is remarkable how the average number of hops and the average Euclidean distance remain
the same across all 10 runs.
- Here is another output from 10 runs.
The difference between this and the previous output is that here p was set to 0.
In other words, the experiment was conducted on UDGs.
Notice how the number of hops increases and the Euclidean distance falls.
This is to be expected because a UDG does not contain "long range" links.
Also notice that the success rate falls to about 87%.
- Here is a single run in which I generated a small world graph (as in Project 1) with n = 10,000 on a 50 by 50 square with p = 0.1 and chose one million st-pairs chosen uniformly at random. As can be seen from the recorded times, it takes less than a minute to generate a small world graph and run the greedy algorithm on a million st-pairs.

You might consider a pared down version of the experiment in which you use 3 values of p, 3 values of D, and 5 different graphs to average over. This is 45 runs for each model and therefore a total of 90 runs. Assuming, 5 minutes per run means that the pared down version of Experiment 3 will complete in 8-9 hours.